
Market Breadth Analysis: A Historical Perspective on the NSE Nifty 500 Index
Understanding market trends and identifying potential opportunities is a key aspect of successful investing. One powerful indicator that provides insights into market sentiment is market breadth, particularly the percentage of stocks trading above their 200-day moving average (DMA). This blog explores the historical patterns of this indicator, its significance, and what it suggests for investors today.
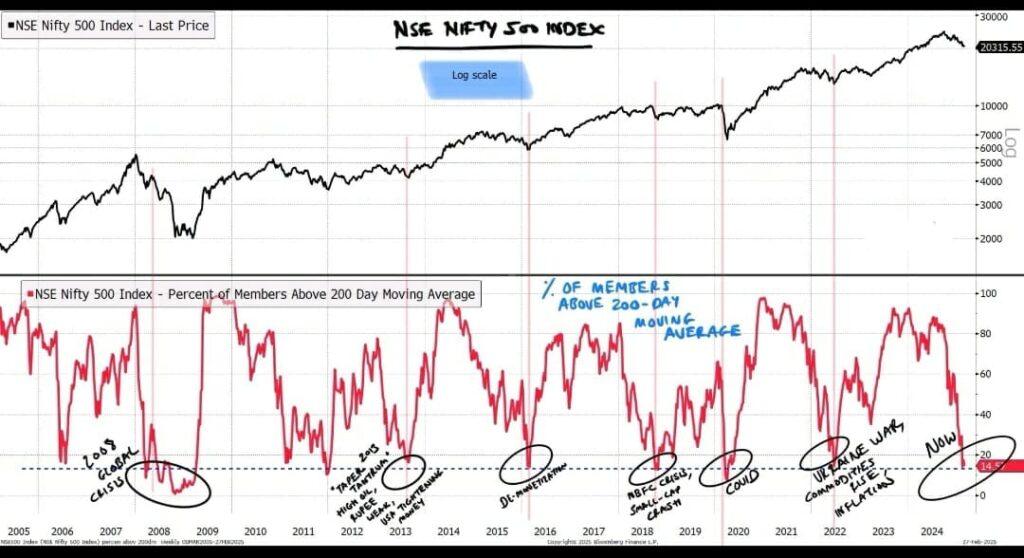
What Does Market Breadth Analysis Chart Show?
The NSE Nifty 500 Index represents a broad segment of the Indian stock market, encompassing large-cap, mid-cap, and small-cap stocks. In the accompanying chart, we analyse:
- The red line – This represents market breadth, showing the percentage of Nifty 500 stocks trading above their 200-day moving average.
- The black line – This represents the Nifty 500 Index price movement over time.
A crucial observation is that when market breadth drops significantly, particularly below 20%, it has historically indicated a market bottom, often followed by a strong recovery. This makes it an essential tool for long-term investors seeking attractive entry points.
Historical Market Bottoms & Recoveries
By analyzing past market downturns, we observe a recurring pattern where a sharp drop in market breadth aligns with market bottoms and subsequent recoveries. Here are some key historical events:
- 2008 Global Financial Crisis: The percentage of stocks above their 200-DMA plummeted, signalling one of the biggest market downturns. However, this period also marked a major buying opportunity, as markets rebounded strongly in the following years.
- 2013 Taper Tantrum & Rupee Depreciation: During this period, fears surrounding U.S. Federal Reserve policies led to significant market declines. However, as market breadth recovered, so did the broader market.
- 2018 NBFC Crisis & Small-Cap Crash: A liquidity crisis in non-banking financial companies (NBFCs) triggered panic selling, resulting in a dip in market breadth. Investors who invest during this phase benefited from subsequent gains.
- 2020 COVID Crash: The pandemic-induced panic led to a historic market collapse, with a drastic drop in the number of stocks trading above their 200-DMA. However, this period turned out to be an exceptional buying opportunity, as markets rebounded sharply.
- 2022 Russia-Ukraine War, Inflation, and Commodities Spike: Geopolitical tensions and inflationary pressures led to another market decline. Yet again, investors who held their positions or entered the market at low levels saw their portfolios recover as stability returned.
Current Market Condition ("NOW")
As of today, the percentage of stocks trading above their 200-day moving average has fallen to a historically low level. If history is any indication, such periods have consistently presented lucrative opportunities for long-term investors.
While short-term volatility and macroeconomic uncertainties may persist, historical data suggests that such low market breadth analysis are often precursors to market recoveries.
Key Takeaways for Investors
Market breadth technical analysis is cyclical
When too few stocks are trading above their 200-DMA, it often signals extreme pessimism and a potential market bottom. These are times when investors should look for value opportunities rather than panic selling.
Long-term investors can benefit from market downturns
History has shown that accumulating quality stocks during these downturns can generate strong returns over time.
Diversification and disciplined investing matter
Spreading investments across different sectors and sticking to a well-defined strategy helps investors navigate market volatility and capitalize on rebounds.
Conclusion
Understanding market breadth analysis and its historical significance provides valuable insights for investors. While no indicator guarantees absolute accuracy, past patterns suggest that periods of low market breadth often coincide with strong buying opportunities.
At Wealthbeats Finserv, we help investors navigate such market cycles with informed insights, disciplined investment strategies, and portfolio diversification. If you’re looking to capitalize on current market conditions, reach out to us for expert financial guidance.
Frequently Asked Questions
What does market breadth mean?
Market breadth refers to the number of stocks participating in a market’s overall movement. It shows whether a rally or decline is broad-based or driven by a few large stocks. Strong market breadth means most stocks are rising, confirming the market’s strength.
How to find market breadth?
You can find market breadth by tracking indicators such as the advance-decline line, new highs vs new lows, or the percentage of stocks above their moving averages (like 50-DMA or 200-DMA). These tools reveal how widely market gains or losses are shared across stocks.
What is the best market breadth indicator?
Some of the best market breadth indicators include the Advance-Decline Line (AD Line), McClellan Oscillator, and Percentage of Stocks Above 200-DMA. These indicators help identify early trend reversals and confirm the overall market direction. One of the most popular market breadth indicators is the Advance/Decline (A/D) Line, which measures the net advances of stocks to gauge overall market participation. According to Investopedia, it helps traders confirm market trends and spot potential reversals.
How to analyse market breadth?
To analyse market breadth, compare the movement of breadth indicators with the major index. If the index makes new highs but breadth weakens, it signals a possible trend reversal. Traders also use divergence between price and breadth as a warning of market weakness.
What is RSI indicator?
The Relative Strength Index (RSI) is a momentum oscillator that measures the speed and change of price movements. While RSI shows whether a stock is overbought or oversold, it’s often used alongside market breadth analysis to confirm market strength or weakness.

Vineet Baheti ,CFP
With over 14 years of experience in wealth management, I am expertise in comprehensive financial planning, including tax planning, retirement planning, and goal-based planning for High-Net-Worth (HNI) and Ultra-High-Net-Worth (UHNI) clients. As a Certified Financial Planner (CFP, Certification Number: IN94288), I provide personalized strategies to help clients achieve financial security, optimize their tax positions, and plan for a prosperous retirement. My approach is centered around building tailored financial plans that align with individual’s unique goals, ensuring their long-term financial success.